/* This is an authorized translation from a French article that was shared by Victor Julien, one of my mentors, and which I thought would be a nice opportunity to study about Suricata, while giving something back to the community. You can find the original on: Détection d’intrusion (IDS) avec Suricata sur Raspberry Pi. I want to thank François, who shared this on twitter, and Stéphane, who wrote it, shared it as copyleft, and not only allowed me to translate and share it in English, but also sent me the originals, to make my task easier. */
Edit: this post was updated on June 3, 2021, to add a few changes made by the author to the original post. (And to fix a few things that were wrong on my side, like like listing numbers).
Author: Stéphane Potier
Date: 03 February 2021

Table of contents
- Introduction
- Required materials
- Architecture
- Setting up Suricata on your Raspberry Pi
- Using Suricata as a service
- Avoiding packet loss
- Using Suricata’s log files
- Managing the rules
- Updating Suricata
- Raspberry Pi resource usage
- Configuring the Port Mirroring on the Zyxel GS1200-5 Switch
- Wifi router configuration
- Introduction
This article details the installation and configuration of Suricata IDS on a Raspberry Pi for you to monitor your local network. In order to be able to monitor all devices in your local network, we will use the port mirroring functionality of a managed switch as well as a small wifi router connected to that switch.
Overview
Suricata is a network IDS (Intrusion Detection System) based on signature detection. It analyzes network traffic in order to detect unusual activities and intrusion attempts.
A Raspberry Pi is the perfect host for Suricata in a small local network.
For the IDS to be able to monitor all equipment on your network, it must analyze all network traffic. This is made possible thanks to using a manageable switch that supports “port mirroring”, to duplicate the traffic from all devices and send it to the IDS.
In order to also be able to monitor wireless equipment traffic, it is necessary to use a small Wifi router. This router must be connected to a port of the switch, so that the Wifi traffic is also duplicated to the IDS by the “port mirroring” function.
- Required materials
- Raspberry Pi 3B or Pi 4 – Model B
- Managed switch with port mirroring Zyxel GS1200
- Wifi Router TP-LINK TL-WR902AC
- Architecture
The IDS must be able to analyze frames coming from all devices on your network.
To achieve this, all your devices must be connected to the switch that uses the port mirroring function to transmit all the frames received from the “mirrored port” to the “analysis port”. The Raspberry Pi on which the Suricata IDS is installed is of course connected to this analysis port.
If you also want to monitor your devices connected via the Wifi network, you should not connect them to the Wifi network of your modem, but use a small Wifi router also connected to the switch on a “mirrored port”.

- Setting up Suricata on your Raspberry Pi
Install Raspberry Pi OS or Raspberry Pi OS Lite on your Raspberry Pi (Model 3B or 4), available at https://www.raspberrypi.org/software/
- Installing Suricata open source IDS
Prepare the installation, by installing the necessary dependencies:
sudo apt install libpcre3 libpcre3-dbg libpcre3-dev build-essential libpcap-dev libyaml-0-2 libyaml-dev pkg-config zlib1g zlib1g-dev make libmagic-dev libjansson-dev rustc cargo python-yaml python3-yaml liblua5.1-devDownload Suricata source code:
wget https://www.openinfosecfoundation.org/download/suricata-6.0.1.tar.gzUntar the sources:
tar -xvf suricata-6.0.1.tar.gz Enter Suricata directory:
cd $HOME/suricata-6.0.1/Configure the installation:
./configure --prefix=/usr --sysconfdir=/etc --localstatedir=/var --enable-nfqueue --enable-luaCompile Suricata:
makeInstall Suricata:
sudo make installGo to suricata-update folder:
cd $HOME/suricata-6.0.1/suricata-update/Build suricata-update:
sudo python setup.py buildInstall suricata-update:
sudo python setup.py installGo to Suricata directory again:
cd $HOME/suricata-6.0.1/Finish Suricata installation, including its rules:
sudo make install-fullUpdate Suricata’s rules:
sudo suricata-update- Setting up Suricata
Configure Suricata by editing suricata.yaml file:
sudo vi /etc/suricata/suricata.yamlChange the variable HOME_NET so that it lists your local network, for instance:
HOME_NET: "[192.168.0.0/24]"- Launching Suricata
Run Suricata with the following command:
sudo suricata -c /etc/suricata/suricata.yaml -i eth0 -S /var/lib/suricata/rules/suricata.rulesWhere:
-c <path> : configuration file to be used
-i <interface> : Ethernet interface to monitor
-S <path> : Suricata rules file
- Testing Suricata
In order to test whether Suricata is running properly, it is useful to add a rule that displays a warning each time an ICMP Echo (ping) is received. This rule should be removed after this test.
Add the following rule in “/var/lib/suricata/rules/suricata.rules”.
alert icmp any any -> any any (msg: "ICMP Packet found"; sid: 1; rev: 1;)Open the log file:
sudo tail -f /var/log/suricata/fast.logYou should see the following alert in the log file:
01/23/2021-21:22:26.898963 [**] [1:1:1] ICMP Packet found [**] [Classification: (null)] [Priority: 3] {ICMP} 192.168.1.16:8 -> 192.168.1.25:0Here are some other ways to test if Suricata is running fine:
- Visiting this site using a browser from a device on your local network:
Must produce the following alert:
02/03/2021-16:13:42.020071 [**] [1:2100498:7] GPL ATTACK_RESPONSE id check returned root [**] [Classification: Potentially Bad Traffic] [Priority: 2] {TCP} 31.3.245.133:80 -> 192.168.1.10:46196- Running the following command from a Linux shell:
dig a 3wzn5p2yiumh7akj.onionShould result in the alert that follows:
02/03/2021-16:19:40.496621 [**] [1:2022048:3] ET MALWARE Cryptowall .onion Proxy Domain [**] [Classification: A Network Trojan was detected] [Priority: 1] {UDP} 192.168.1.10:37423 -> 192.168.1.1:53
- Using Suricata as a service
To be able to use Suricata as a service, the file “/etc/systemd/system/suricata.service” must be created:
sudo vi /etc/systemd/system/suricata.serviceAdd the following:
# Sample Suricata systemd unit file.
[Unit]
Description=Suricata Intrusion Detection Service
After=network.target syslog.target
[Service]
ExecStart=/usr/bin/suricata -c /etc/suricata/suricata.yaml -i eth0 -S /var/lib/suricata/rules/suricata.rules
ExecReload=/bin/kill -HUP $MAINPID
ExecStop=/bin/kill $MAINPID
[Install]
WantedBy=multi-user.target
And then enable this new service with the command:
sudo systemctl enable suricata.serviceWe can now use Suricata as a service, and start it by running:
sudo systemctl start suricata.serviceIn order to stop it:
sudo systemctl stop suricata.serviceTo restart it:
sudo systemctl restart suricata.serviceTo check its status:
sudo systemctl status suricata.serviceThe service will now launch automatically when the Raspberry Pi is started.
- Avoiding packet loss
Suricata may require some optimizations in order to work optimally on your network. This depends of course on the number of devices to be monitored and the traffic generated.
Check that the “capture.kernel_drops” variable in the “/var/log/suricata/stats.log” file is not too high. Ideally, it should remain at 0 and therefore not be displayed in the counter list.
-------------------------------------------------------------
Date: 1/28/2021 -- 18:29:22 (uptime: 0d, 03h 02m 49s)
-------------------------------------------------------------
Counter                     | TM Name          | Value
-------------------------------------------------------------
capture.kernel_packets      | Total            | 2310188
capture.kernel_drops        | Total            | 21617
decoder.pkts                | Total            | 2288600
decoder.bytes               | Total            | 1882135284
decoder.ipv4                | Total            | 2272391
decoder.ipv6                | Total            | 24
decoder.ethernet            | Total            | 2288600
decoder.tcp                 | Total            | 1320915
In the above case, 21617 packets out of 2310188 were lost, or about 1%. This is acceptable, but this loss is avoidable.
For example, you can increase the value of the variable “ring-size” in the configuration file “/etc/suricata/suricata.yaml“. Be careful, you must of course delete the “#” in front of the variable in the file. This modification is generally sufficient to avoid losing packages.
Modify the value of “ring-size” by changing the following line in the file “/etc/suricata/suricata.yaml“:
#ring-size: 2048to:
ring-size: 30000After increasing this variable to 30,000, I no longer observe any packet loss, even with 7.8 million packets received.
-------------------------------------------------------------------------
Date: 1/31/2021 -- 17:11:29 (uptime: 0d, 20h 49m 24s)
-------------------------------------------------------------------------
Counter                          | TM Name           | Value
-------------------------------------------------------------------------
capture.kernel_packets           | Total             | 7885374
decoder.pkts                     | Total             | 7885383
decoder.bytes                    | Total             | 7978255434
I invite you to read the Suricata documentation to fine-tune the configuration settings that have an impact on the software performance.
- Using Suricata’s log files
Suricata generates log files in the /var/log/suricata directory. In addition to the network traffic and suspicious activities it detects, Suricata also logs service information and network traffic statistics. On a Raspberry Pi, you will have to pay attention to the size of the generated logs, which can quickly saturate the SD card used to store them. A log rotation mechanism must be implemented to avoid any problems.
- The different log files
Here are the 4 log files generated by Suricata:
- suricata.log: Suricata startup messages
- stats.log: statistics on your network traffic
- fast.log: suspicious activities detected by Suricata
- eve.json: your local network traffic and suspicious activities in JSON format
- Suspicious activity log file
To view live the suspicious activities detected by Suricata, just take a look at the “fast.log” file:
sudo tail -n 100 -f /var/log/suricata/fast.log Here is an example of suspicious activities detected by Suricata recorded in the “fast.log” file:
01/29/2021-19:25:45.132975 [**] [1:2025012:3] ET MALWARE Powershell commands sent B64 3 [**] [Classification: A Network Trojan was detected] [Priority: 1] {TCP} XXX.XXX.XXX.XXX:80 -> 192.168.1.22:45986
01/29/2021-19:26:10.183249 [**] [1:2013147:3] ET SHELLCODE Possible %u4141%u4141 UTF-16 Heap Spray Attempt [**] [Classification: Executable code was detected] [Priority: 1] {TCP} XXX.XXX.XXX.XXX:80 -> 192.168.1.22:45986
01/31/2021-10:08:08.889128 [**] [1:2002157:12] ET CHAT Skype User-Agent detected [**] [Classification: Potential Corporate Privacy Violation] [Priority: 1] {TCP} 192.168.1.2:53937 -> XXX.XXX.XXX.XXX:80
- Log files rotation
The size of the “eve.json” log file can quickly become very large and take up all the space on the SD card. The use of the “logrotate” mechanism integrated in Linux is very useful to avoid this. We will configure it to log Suricata logs for 10 days, while limiting the size of each file to 1 GB. So the logs will not be able to take up more than 10 GB on the SD card while having a history over the last 10 days. Older histories are automatically deleted.
Create a file “/etc/logrotate.d/suricata” with the following content:
/var/log/suricata/*.log /var/log/suricata/*.json
{
    daily
    maxsize 1G
    rotate 10
    missingok
    nocompress
    create
    sharedscripts
    postrotate
    systemctl restart suricata.service
    endscript
}
In order to check that the rotation is correctly configured and that it works, you can force it manually with the command:
sudo logrotate -f /etc/logrotate.conf You should then see the logs recorded in the “/var/log/suricata/” directory.
pi@raspberrypi3:~ $ ls -l /var/log/suricata/
total 30024
drwxr-xr-x 2 root root     4096 Jan 23 18:17 certs
-rw-r--r-- 1 root root        0 Feb  2 15:03 eve.json
-rw-r--r-- 1 root root  5162813 Feb  2 15:03 eve.json.1
-rw-r--r-- 1 root root 19174088 Feb  2 14:44 eve.json.2
-rw-r--r-- 1 root root        0 Feb  2 15:03 fast.log
-rw-r--r-- 1 root root      354 Feb  2 14:45 fast.log.1
-rw-r--r-- 1 root root     1944 Feb  2 14:35 fast.log.2
drwxr-xr-x 2 root root     4096 Jan 23 18:17 files
-rw-r--r-- 1 root root        0 Feb  2 15:03 stats.log
-rw-r--r-- 1 root root   550978 Feb  2 15:03 stats.log.1
-rw-r--r-- 1 root root  5810640 Feb  2 14:44 stats.log.2
-rw-r--r-- 1 root root      965 Feb  2 15:03 suricata.log
-rw-r--r-- 1 root root     1737 Feb  2 15:03 suricata.log.1
-rw-r--r-- 1 root root     1740 Feb  2 14:44 suricata.log.2
- Network traffic log file
The size of the “eve.json” network traffic log file can grow significantly, depending on your network traffic.
If you are only interested in the alerts in the “fast.log” file, disable the “eve.json” log file in the “/etc/suricata/suricata.yaml” configuration file. But beware, in this case you will not have logs allowing you to analyze the cause of the alerts.
  - eve-log:
      enabled: no
- Managing the rules
The effectiveness of Suricata IDS is based on good rule management. It is necessary to both avoid false positives and to ensure that the rules used are up to date and allow the detection of recent threats.
Suricata’s default activated rules generate many false positives (alerts that are not real issues). I recommend letting Suricata run for a few hours with normal use of your devices and, to finely analyze the alerts in the “fast.log” file and then disable some rules. For example, if you use Dropbox or Skype on your network, you will have to disable the corresponding rules in order not to generate unnecessary alerts for your network.
To increase the security of your setup, you may also need to add new rule sources or create your own rules.
We will see how to manage this in the following chapters.
- Rules format
Each Suricata rule follows the pattern:
action header options
Action corresponds to the action performed in case of detection (alert, drop, pass…).
The header allows one to define the protocol (tcp, http, ftp, dns, tls…) as well as the IP address and port of source and destination of the traffic involved in the alert.
The rule’s options are indicated in brackets and separated by commas. Some options have parameters, which are specified by their keyword, followed by a colon and the value of the parameter.
Rules are identified by their signature identifier, the sid parameter.
For example, here is the rule 2012647 related to Dropbox usage:
# alert tls [108.160.162.0/20,162.125.0.0/16,192.189.200.0/23,199.47.216.0/22,205.189.0.0/24,209.99.7 0.0/24,45.58.64.0/20] 443 -> $HOME_NET any (msg:"ET POLICY Dropbox.com Offsite File Backup in Use"; flow:established,from_server; content:"|55 04 03|"; content:"|0d|*.dropbox.com"; distance:1; within:14; threshold: type limit, count 1, seconds 300, track by_src; reference:url,www.dropbox.com; reference:url,dereknewton.com/2011/04/dropbox-authentication-static-host-ids/; classtype:policy-violation; sid:2012647; rev:5; metadata:created_at 2011_04_07, updated_at 2019_01_16;)
You can have a look at the rules by checking Suricata rules file:
sudo vi /var/lib/suricata/rules/suricata.rules- Disabling specific rules
Depending on your usage, some rules may need to be disabled. For example, if you allow the use of Dropbox within your network, SID 2012647 rule must be disabled.
Edit the file that contains the rules to be disabled:
sudo vi /etc/suricata/disable.confAdd the list of rules to disable, identified by their signature identifier (SID).
Here is an example of rules that I have disabled on my setup:
# suricata-update - disable.conf

1:2012647 # Dropbox
1:2013504 # APT package management
1:2210044 # SURICATA STREAM Packet with invalid timestamp
1:2029706 # COVID
1:2029707 # COVID
1:2029709 # COVID
1:2027865 # DNS Query to .cloud
1:2210054 # SURICATA STREAM excessive retransmissions
1:2260000 # Applayer Mismatch protocol both directions
1:2210020 # STREAM ESTABLISHED packet out of window
1:2016150 # INFO Session Traversal Utilities for NAT
1:2027758 # DNS Query for .cc
1:2002157 # CHAT Skype User-Agent detected
If needed, it is possible to disable all rules belonging to a same “classtype” classification type. For example, the “Generic Protocol Command Decode” classification generates too many alerts for my taste and it is possible to deactivate all the rules for this classification.
# suricata-update - disable.conf

# Disable all rules from protocol command decode class type
re:classtype:protocol-command-decode
Then it is necessary to update the rules (see Updating the rules).
- Adding a new rules source
It is possible to add new rules from a particular source.
First, update the list of available sources:
sudo suricata-update update-sourcesThen, display the available sources:
sudo suricata-update list-sourcesIn order to check which sources are already active, run the following command:
sudo suricata-update list-enabled-sourcesActivate a new source, for instance, the “oisf/trafficid” rule source.
sudo suricata-update enable-source oisf/trafficidYou will then have to update the rules (see Updating the rules).
- Updating the rules
In order to incorporate the detection of the latest threats, it is necessary to regularly update Suricata’s rules by running the following command:
sudo suricata-update --disable-conf=/etc/suricata/disable.confThen you can simply restart Suricata:
sudo systemctl restart suricata.service- Automatically updating the rules at night
You can use a cron (a schedule table on Linux) to automatically update Suricata rules every night.
Edit the schedule file with the command:
crontab -eAnd add the following line at the end of the file:
37 1 * * * sudo suricata-update –disable-conf=/etc/suricata/disable.conf && sudo systemctl restart suricata.service
With this line, we configure the cron to update the rules every night at 1:37am, and then restart the Suricata service.
- Updating Suricata
Check if a new version of Suricata is available with the command:
sudo suricata-update check-versionsIf a newer version is available, here we see that version 6.0.2 is available to replace version 6.0.1:
6/6/2021 -- 15:59:03 - <Info> -- Using data-directory /var/lib/suricata.
6/6/2021 -- 15:59:03 - <Info> -- Using Suricata configuration /etc/suricata/suricata.yaml
6/6/2021 -- 15:59:03 - <Info> -- Using /usr/share/suricata/rules for Suricata provided rules.
6/6/2021 -- 15:59:03 - <Info> -- Found Suricata version 6.0.1 at /usr/bin/suricata.
6/6/2021 -- 15:59:03 - <Warning> -- Suricata version 6.0.1 is outdated. Please upgrade to 6.0.2.
The installation of the new version is done like a normal installation, and if you want you can do it in the same folder.
The use of a variable containing the latest version of Suricata will be very useful for the next updates. You just have to modify the content of this variable and the following commands will be identical.
export LATEST_SURICATA=6.0.2Download the newest Suricata sources:
wget https://www.openinfosecfoundation.org/download/suricata-$LATEST_SURICATA.tar.gzExtract the sources:
tar -xvf suricata-$LATEST_SURICATA.tar.gz
Go to the Suricata folder:
cd $HOME/suricata-$LATEST_SURICATA/Configure the software installation:
./configure --prefix=/usr --sysconfdir=/etc --localstatedir=/var --enable-nfqueue --enable-luaCompile Suricata:
makeInstall Suricata:
sudo make installand simply restart the service:
sudo systemctl restart suricata- Raspberry Pi resource usage
As a reference, here is the resource consumption of a Raspberry Pi 3 Model B running Suricata.
- Processor usage
On average, 27% CPU usage:
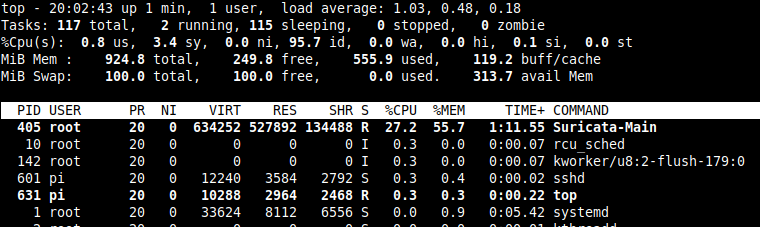
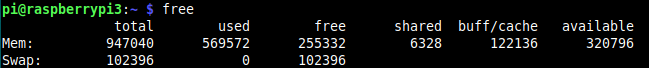
- Memory consumption
569 MB of memory used:
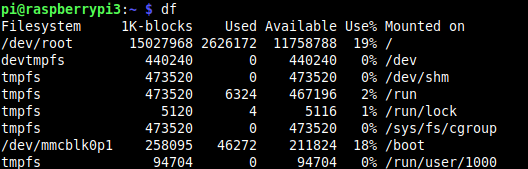
- SD card usage
2.6GB of disk space used:
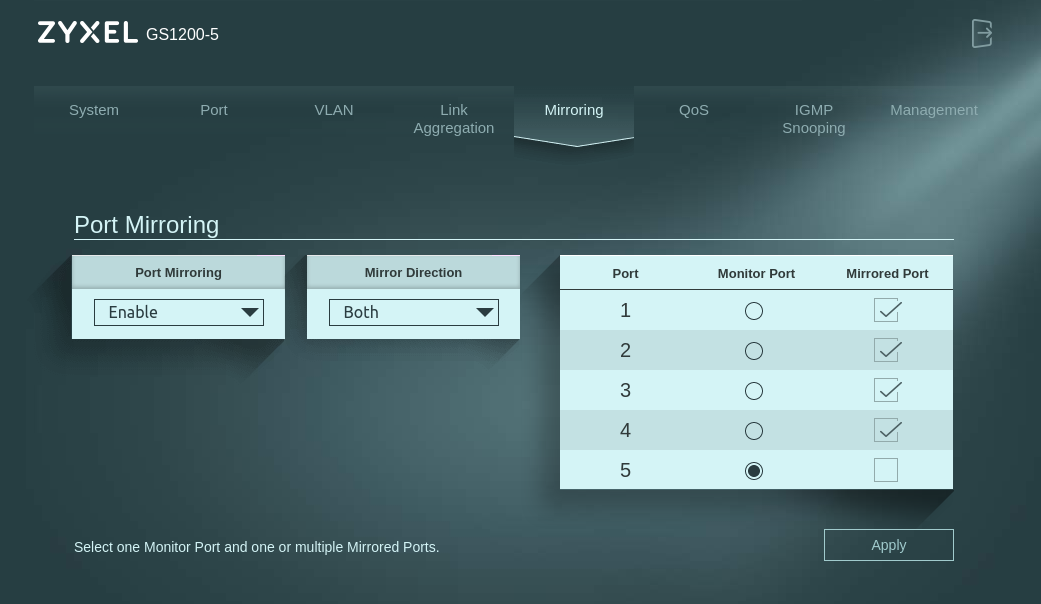
- Configuring the Port Mirroring on the Zyxel GS1200-5 Switch
Suricata IDS runs on the Raspberry Pi which is connected to the port 5 of the switch. The equipment to be monitored is connected to ports 1 to 4 of the switch.
In order to be able to analyze the traffic of all devices connected to this switch, port 5 must be configured as a monitor port and ports 1 to 4 as a mirrored port in both inbound and outbound directions.
This way, all traffic coming in or going out from ports 1 to 4 of the switch will be copied (mirrored) to port 5 to be analyzed by our Suricata IDS running on the Raspberry Pi.
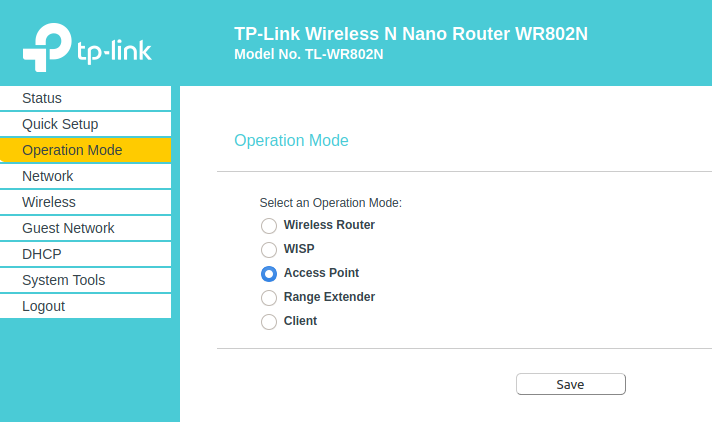
- Wifi router configuration
The Wifi router is connected to a “mirrored port” of the switch, it must be configured in “Access Point” mode. This way, the devices connected to it via Wifi will be on the same local network and can be monitored by our IDS.

Consult the router’s documentation if needed, but the setup is quite simple as you only need to declare operating mode as “Access Point” and use “Smart IP (DHCP)” LAN type.

p.s.: this translation is made much better thanks to tools like DeepL, Google Translate and Wikipedia! ❤

pi@safwanpi4:~/suricata-6.0.1 $ ./configure –prefix=/usr –sysconfdir=/etc –localstatedir=/var –enable-nfqueue –enable-lua
./configure: line 2607: config.log: Permission denied
./configure: line 2617: config.log: Permission denied
Getting this error?
Hey, getting a permission denied error right there sounds a bit odd to me, but I believe this should be solved if you ran that with `sudo`:
`sudo ./configure –prefix=/usr –sysconfdir=/etc –localstatedir=/var –enable-nfqueue –enable-lua`
Please let me know if that (and the rest) worked!
Thanks for leaving a comment! 🙂
Sure thanks for the reply I’ll double check the command also try with sudo.
Wow, that was fast! 😛 After commenting, I noticed that the double dash issue is probably just WordPress messing up with the formatting, so I believe you’re good on that end.
I have UniFi switch and USG 3P which has IPS/IDS but using that it throttle the CPU as well as bandwidth loss so trying this method 😇
safwantechr7, how did this go for you? I have a similar Unifi setup. Were you successful? If so, what did you think of it?
I tried to install 6.0.4 on 4gb based on buster. After trying suricata and suricata-update ends in an error based on someting with libhtp. In some blogs you can read that sudo apt install python-distutils-extra should help. It will not. You have to use sido apt install python3-distutis-extra. this helps on my installation.
Thanks for sharing your solution with us! Do you recall anything else about the libhtp error?
sudo ldconfig /usr/local/lib
after this command i can start suricata, not only suricata-update.
still having some signature errors
now it seems to run all fine.
doing the setup for suricata-update, also python3 instead of python.
a kind of interessting that this helps, … .. .
I had the python3 issue as well – but not on RPi, as I haven’t tried that yet – need all the setup! I think it’s a python thing?
Package ‘python-yaml’ has no installation candidate
Are you trying with the latest Ubuntu? Indeed, I couldn’t find ‘python-yaml’ for jammy (https://packages.ubuntu.com/search?suite=jammy&arch=any&searchon=names&keywords=python-yaml). python3-yaml is available, though, and I would expect it to be enough
Hello, I installed Suricata per this tutorial. I am looking for the Web GUI but cannot find it. Please help!
Hello, I apologize, but I don’t quite understand what do you mean by Web GUI. Suricata doesn’t have a native GUI – local or web based.
Are you referring to some other tool mentioned in the tutorial?
The Image under 3. Architecture is unclear. I have a 16×1 GBps switch. Do I need to mirror 15 Ports to just one mirror port, or is it enough if I mirror the one Router port connected to the internet, since all external traffic goes through the router port anyways?
As stated, I’m not the post’s original author, just a translator. So honestly that setup detail is out of my current knowledge. I do think that you can find good tutorials explaining how to properly use the switch’s mirror function.
From my brief reading, you want your switch to copy traffic from all ports. If that is done by copying input traffic directly, or after traffic has been processed to be directed to each specific port, I humbly don’t have an answer.